Spectrum
 |
The top half of the display shows a Spectral Power Distribution (SPD) chart, or simply ‘spectrum’. |
 |
The horizontal axis ranges from 400nm to 700nm (non-NIR variants) or 400nm to 750nm (+NIR variants). Note that 400-700nm corresponds to the PAR range, but the 400-750nm range has not been named yet. These ranges are used because they contain most of the spectral power for the respective models. Advertised PPF and PPF Total numbers are unrelated to the spectrum visualization.The vertical axis is autoscaling and the unit is µmol/s/nm. Spectra in µmol/s/nm look different from spectra in W/nm (sometimes found in other products).
In addition to the spectral distribution chart, the following decorations can be seen on the chart: The first three decorations can be disabled on the menu. ⮕ See chapter Menu System. |
The top half of the display shows a Spectral Power Distribution (SPD) chart, or ‘spectrum’.
The vertical axis is autoscaling and the unit is µmol/s/nm. Spectra in µmol/s/nm look different from spectra in W/nm (sometimes found in other products)
In addition to the spectral distribution chart, the following decorations can be seen on the chart:
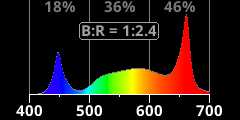
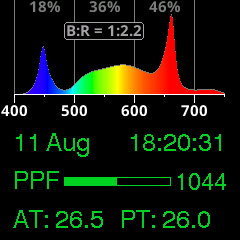
• Percentages of blues (400‑500nm), greens (500‑600nm), and reds (600‑700nm) relative to PAR,
• Grid lines between blues, greens, reds, and NIR,
• B:R ratio, which equals “1:x” where x is reds÷blues. When x exceeds 10.0, “1:‑‑” is shown.
• A ‘night mode’ indicator shows when the outputs are off because of scheduled night.
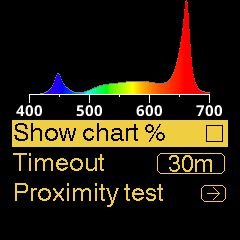 |
The first three decorations can be disabled in the menu. ⮕ See chapter Menu System. |